
Give an AI reporting tool a defined export and calculation rules, then reconcile its numbers before reviewing its prose. Keep clicks, sessions, orders and revenue distinct; report refunds and attribution limits, and ask the model to identify unknown causes instead of inventing explanations.
In this article
An AI-assisted marketing report should let another person reproduce its figures from the same records. The hypothetical agency example below shows which checks to run before sharing it. An agency can use AI to summarise a marketing export, but it still needs to verify the period, currency, denominators and revenue scope. A fluent explanation is not proof that the arithmetic or its claimed cause is correct.
The method reconciles events and definitions rather than describing a local population. GBP identifies the fictional dataset’s currency. For another account, preserve the original currency and report settings; do not convert or combine currencies without a documented basis.
Set the reporting scope before merging exports
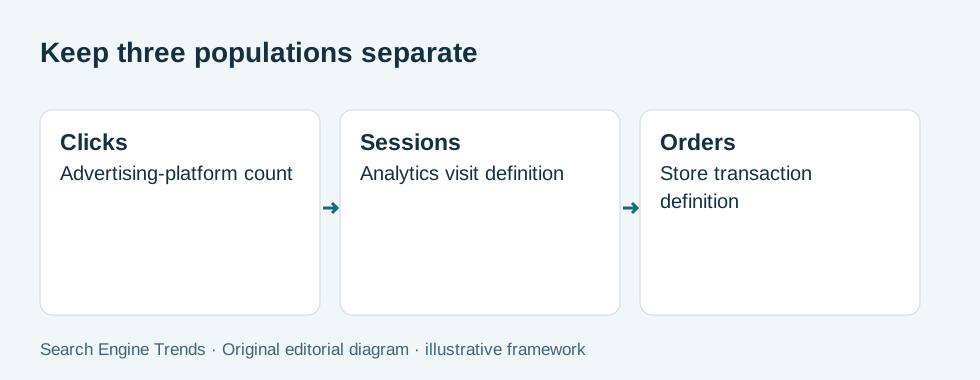
For a hypothetical agency, choose one stated period and record extraction dates, account scope and GBP currency. Keep advertising-platform clicks, analytics sessions and store orders in separate fields. They describe different events and should not be merged into a generic “visitors” column.
Google’s reporting data expectations explain reasons report outputs can differ. Match dates, dimensions, metrics and filters when comparing the relevant interface and API output. Review freshness and the response information available in the actual report instead of assuming a discrepancy proves tracking failure.
Use a small data dictionary. Each field needs a source and meaning: whether sales include tax, whether orders are completed, how refunds are represented and which filters apply. An export can be numerically tidy while using definitions that do not support the comparison the client wants.
Use a small hypothetical CSV as the review input
The values below are invented for teaching. Field names are editorial worksheet labels, not a claim that these are the exact names returned by a platform API.
period,currency,ad_spend,ad_clicks,analytics_sessions,store_orders,store_gross_sales,refunds
example-period,GBP,600,1200,900,18,900,100
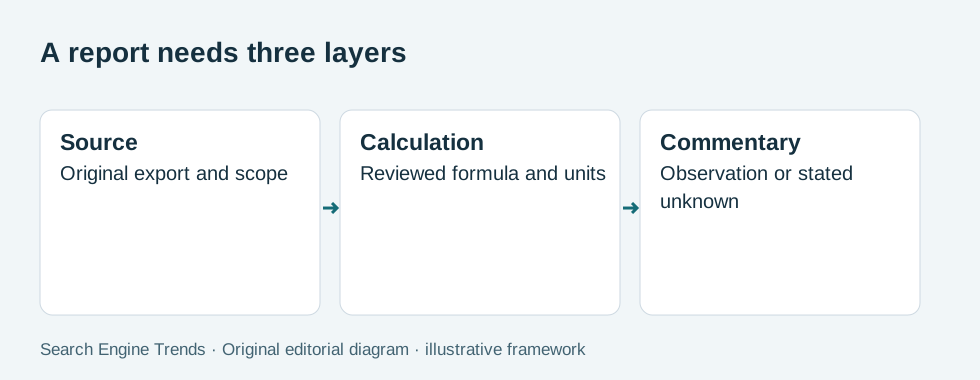
Preserve the original export and create a separate reviewed worksheet. Do not overwrite a source total with the AI’s interpretation. If the model identifies an inconsistency, retain its question and investigate the actual record before changing the data.
The difference between 1,200 clicks and 900 sessions does not establish a 300-person loss. Clicks and sessions are different counts, and the collection scope may differ. Investigate the journey and settings, but label the explanation as unresolved until evidence supports it.
Check five numbers with explicit formulas
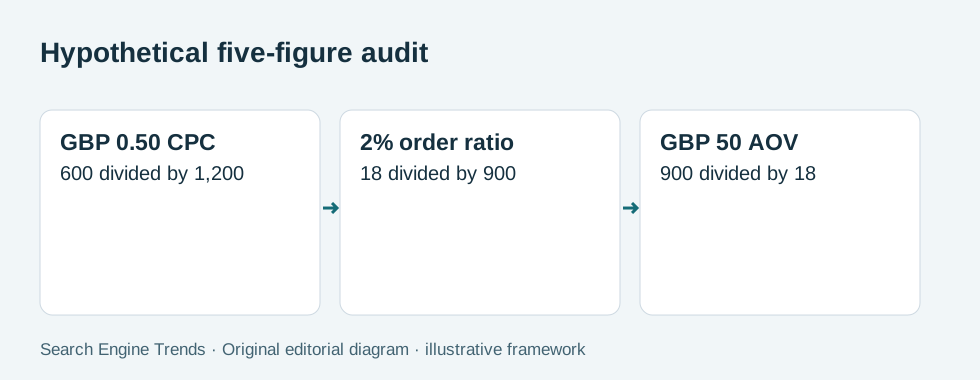
| Teaching check | Calculation | Illustrative result |
|---|---|---|
| Advertising spend | Export field | GBP 600 |
| Cost per recorded click | 600 ÷ 1,200 | GBP 0.50 |
| Orders per recorded session | 18 ÷ 900 | 2% |
| Gross store sales | Export field | GBP 900 |
| Gross average order | 900 ÷ 18 | GBP 50 |
These calculations are valid for the stated hypothetical fields. They are not automatically platform-reported conversion metrics. The order/session ratio needs a clear scope, while the average order figure uses gross sales before the example refunds.
Subtracting the hypothetical GBP 100 refunds leaves GBP 800 under this simplified revenue convention. That is retained revenue for the example, not profit. Product costs, fulfilment, payment costs and agency work still need their own treatment.
Check edge cases before automating the template. A period with zero clicks should not create an infinite cost per click. A period with zero orders should not display a meaningful average order value. Mark the calculation unavailable and explain the denominator rather than replacing it with an invented value.
Ask for bounded commentary rather than a story
Give the model the reviewed figures and explicit rules: show the denominator, preserve the source labels, distinguish observation from hypothesis and say when a cause is unknown. It can explain that the worksheet contains eighteen orders, but it cannot infer that a new creative caused them.
Avoid prompts such as “explain why performance improved” when no valid comparison is supplied. First ask whether there is a comparable prior period. If there is, check scope, product availability, promotions and measurement changes before interpreting the difference.
Google’s API metric and dimension reference helps identify fields in an actual implementation. Map those fields to the worksheet deliberately rather than letting AI substitute a similarly named metric with another meaning.
Keep revenue, attribution and causality separate
The store ledger can show a sale. An attribution report can assign credit under a chosen model. Neither alone establishes the incremental sale that would not have occurred without the campaign. Use those distinctions when explaining results to the merchant.
Reconcile refunds and late corrections with a dated revision note. A previous report might have shown GBP 900 before a later GBP 100 refund. The final GBP 800 figure should carry that explanation, rather than making the earlier report appear arbitrarily wrong.
Keep small counts visible beside rates. A 2% ratio based on eighteen orders has a different evidence base from the same ratio based on thousands. Avoid confident forecasts or causal claims drawn from a small illustrative dataset.
Reporting checklist
- Match period, currency, filters and extraction scope.
- Keep clicks, sessions and orders distinguishable.
- Retain the original CSV and field dictionary.
- Recalculate the five key figures independently.
- Mark zero-denominator calculations unavailable.
- Reconcile refunds and later corrections.
- Remove explanations that lack supporting evidence.
The final client report should include a useful next review: inspect a broken landing step, resolve a source mismatch or obtain a comparable period. A numerical summary is complete when its figures can be reproduced and its limits are clear, not when every blank space has been filled with an optimistic explanation.
Recalculate totals before asking the model for a trend. If two campaign rows have conversion rates of 1% and 4%, averaging them gives 2.5%, but that is only valid for the combined rate when the denominators are equal. Add the underlying orders and sessions first, then divide. A small high-converting campaign can otherwise dominate the written narrative while contributing few purchases.
Preserve currency as a validation field even when every current row uses GBP. A later USD export should fail the aggregation rule until a documented conversion basis exists. Similarly, a blank refund cell should mean “unknown” until confirmed; replacing it with zero makes the retained-sales result look more certain than the evidence allows.
FAQ
Can AI calculate a report directly from a CSV?
It can assist, but verify calculations and source meanings independently. A correct division can still use the wrong denominator or revenue scope.
Are eighteen orders divided by nine hundred sessions a conversion rate?
It is the stated worksheet ratio. Confirm the periods and counting conventions before presenting it as the platform’s conversion measure.
Should a report explain every change?
Explain supported findings and identify unknown causes. A clearly unresolved question is more useful than an invented reason that sends the client towards the wrong action.

Advanced SEO and Automation
Explore this related DIY Marketing Guide guide to work further on the method. DIY is part of our business group; contents, language and price are shown on its store.
See the English guide