
The dedicated Search Console generative AI report measures visibility through impressions. Use it to inspect pages and markets under consistent filters. Keep overall search clicks, referral sessions and purchases in separate records; they cannot supply a dedicated AI click-through rate without a corresponding AI click metric.
In this article
Use Search Console’s generative AI performance report to understand whether links to your pages appeared in supported AI features on Google Search. The dedicated view reports impressions. An impression is not a website visit, and combining these impressions with unrelated click totals does not create a valid AI click-through rate.
Google announced the reports on 3 June 2026, then updated the announcement to confirm worldwide rollout on 31 August. The report concerns visibility in Google’s features; it is not an inventory of every AI assistant or a record of visits from all generative systems.
Start with the decision the report can support
A useful reporting question is, “Which product guides appeared more often within the selected market and period?” That question fits an impression report. “How many AI visitors purchased?” requires traffic and transaction evidence that this visibility count does not itself supply.
Write the question at the top of your working document. Then identify the selected property, period and scope. This makes it harder to slide from a narrow visibility observation into an unsupported commercial conclusion when presenting the results.
Separate an observation from the proposed explanation. “Page A had more reported impressions in this comparison” can be observed in a defined export. “The new compatibility table caused that increase” requires additional evidence. Search demand, competing results and other site changes can also affect the period.
Use the Q4 hub to connect the visibility review with scheduled product-page work. A campaign deadline helps organise effort, but it does not make the report a sales forecast.
Freeze the comparison settings before exporting
Choose a repeatable comparison period and record all filters. Avoid comparing a short promotional weekend with a full month and describing the raw difference as an improvement. If the commercial calendar differs, explain that limitation before calculating a percentage.
Google’s report documentation identifies page, country, device and date groupings. Dates use Pacific Time. Page data generally follows the canonical destination, while chart and table aggregation can differ. These details matter when a spreadsheet appears not to reconcile.
For an original working-sheet design, record property, period_start, period_end, country_filter, device_filter, search_type, grouping, exported_at and preliminary_data_note. These are suggested worksheet fields, not a claim about the API’s field names.
Retain the original export separately from calculations. If a reviewer later discovers a changed country filter, the comparison can be reconstructed without guessing which version of the spreadsheet produced the written summary.
Do not assume that two exports with similar filenames represent matching populations. Open their configuration records first. A pages table for all countries and a mobile-only country view answer different questions even when both contain a column labelled impressions.
Work through a hypothetical two-page example
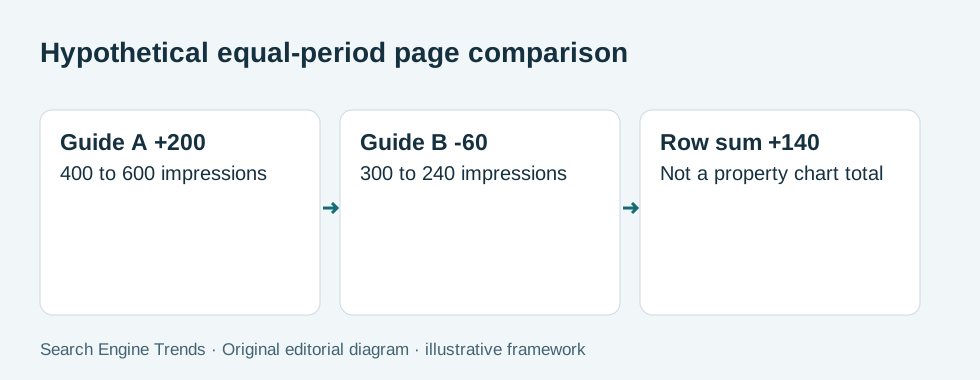
Consider two imaginary buying guides reviewed across two equal, completed periods, with the same property and country filter. The following numbers are invented solely to demonstrate the calculation; they are not measurements from a client or Search Engine Trends.
| Hypothetical page | Earlier period impressions | Later period impressions | Difference |
|---|---|---|---|
| Compact organiser buying guide | 400 | 600 | +200 |
| Desk lamp compatibility guide | 300 | 240 | −60 |
For the organiser guide, 200 divided by 400 gives a 50% relative increase. For the lamp guide, minus 60 divided by 300 gives a 20% decrease. The count and percentage should appear together so that a small starting value does not look like evidence of a large audience.
The sum of the page rows changes from 700 to 840, an increase of 140. Call this a sum of these two hypothetical page rows. Do not label it the property’s chart total: if several pages appear within the same result context, the report’s aggregation rules can produce a different property-level count.
If a third page begins with zero reported impressions and later has twenty, report the count change. A percentage increase from a zero denominator is undefined; “infinite growth” is not a useful commercial interpretation.
A review action could be to inspect whether the lamp guide still matches the available model versions. This is a sensible investigation, not proof that compatibility information caused the observed decrease. The decision to correct an inaccurate product fact can stand on its own evidence.
Keep visibility, clicks and business outcomes in separate lanes
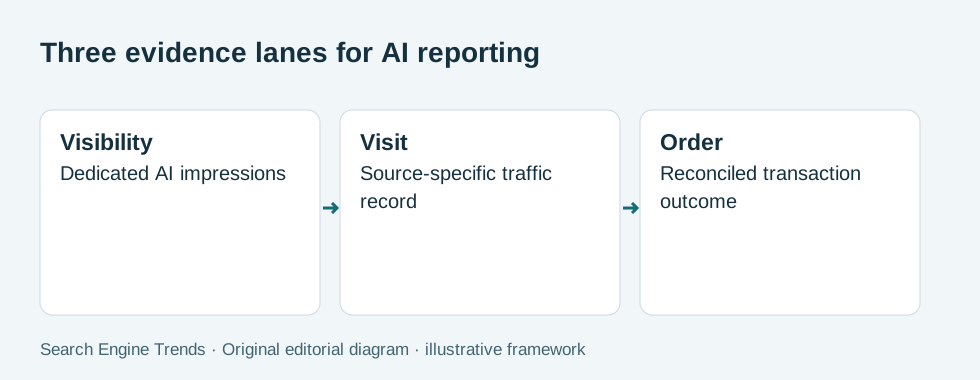
Suppose a separate overall Search report shows 100 clicks for the organiser page during the later period. Dividing those clicks by its 600 dedicated AI impressions would mix two populations. It would not establish an AI CTR of 16.7%.
Similarly, an analytics system might identify sessions with a particular referral source. Those sessions describe visits under that system’s collection and attribution rules. They do not automatically represent every impression in Google’s generative AI report, nor do they identify which displayed AI result prompted a purchase.
Create a reporting dictionary with four entries: dedicated AI impressions, overall Search clicks and CTR, identifiable referral sessions, and reconciled orders. State the source and limitation beside each. Report the values together only when the relationships are explained; do not add them into one “AI performance score”.
Use the measurement tools for calculations and the resources for the working register. Tracking parameters are appropriate on links the business actually controls. They cannot be retroactively attached to all externally generated search links to manufacture missing attribution.
Check access and inclusion before interpreting an absent report
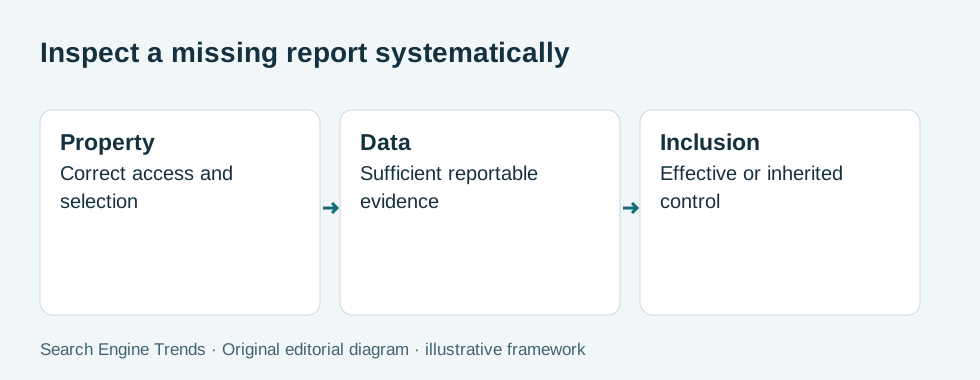
An unavailable or empty view is a troubleshooting condition. Verify the selected property and the operator’s permissions. Then check whether sufficient reportable data exists and whether the site is included in the relevant features. Record the outcome as unavailable, excluded or observed zero only when the evidence supports that label.
Google’s Search generative AI control documentation describes inclusion, exclusion and inheritance from a parent property. Inspect the effective setting, not merely the name of the current URL-prefix property. This control concerns appearance in the specified Search features; Google-Extended addresses model training separately.
Do not change the inclusion choice just to improve a dashboard without understanding the publisher’s intended policy. A reporting review can identify the setting and its owner, then route any change through the site’s existing decision process.
AI report review checklist
- Confirm the property and operator access.
- Record dates, countries, devices and search type.
- Label the grouping and aggregation basis.
- Keep preliminary or unavailable values distinguishable.
- Show counts alongside percentage changes.
- Leave dedicated impressions separate from overall clicks.
- Check effective inclusion or inherited settings.
- Record an investigation action without inventing a cause.
Google notes that exported unavailable markers can become zeros. Preserve a note about the source display when that distinction matters; otherwise a spreadsheet can silently turn missing information into an apparently measured absence.
FAQ
Does the dedicated report provide an AI CTR?
Its documented dedicated metric is impressions. Do not construct a dedicated AI CTR using overall Search clicks as the numerator.
Does worldwide rollout mean every operator sees data immediately?
No. Property selection, access, sufficient data and inclusion conditions still need checking. An absent view alone does not prove that the site received no relevant visits.
Can an impression increase prove the value of a page rewrite?
It can document a visibility change under the selected comparison. Establishing the cause or commercial value requires further evidence, with the timing and other changes made explicit.

GEO: Understand and Act
Explore this related DIY Marketing Guide guide to work further on the method. DIY is part of our business group; contents, language and price are shown on its store.
See the English guide